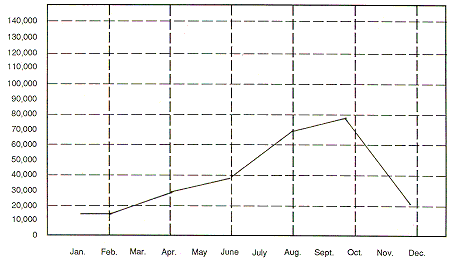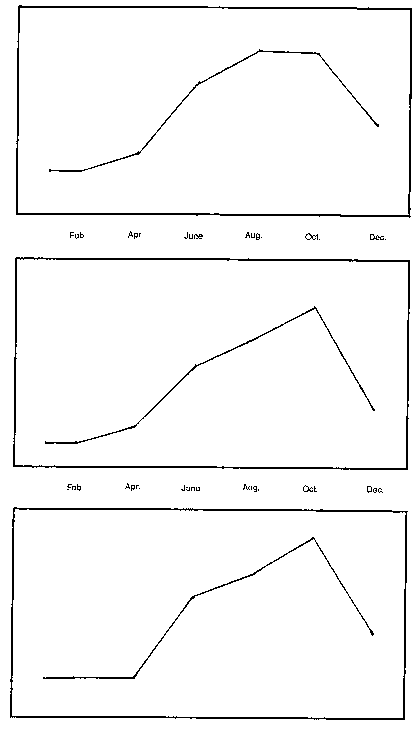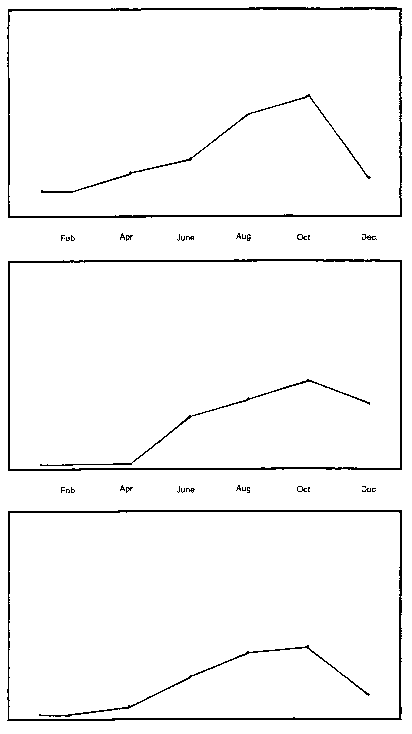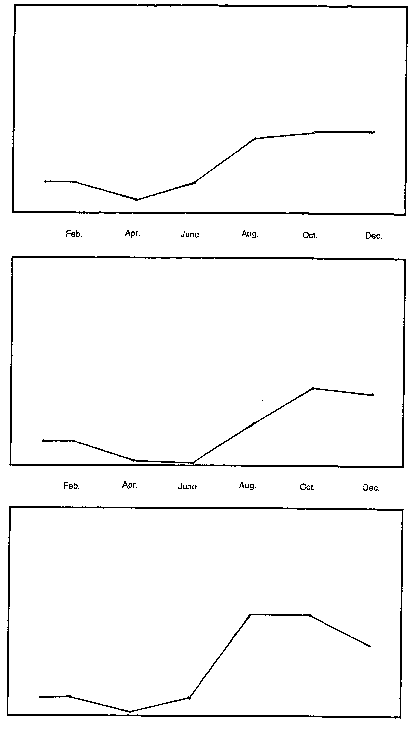
The graphs reflect one year of water use for each home during the drought years; 1987-1992. We divided the year up into two month blocks to simulate a water billing cycle. one
center point between each month represents every other month. The measurement scale
ranges from 10,000 gallons to 140,000 gallons of water.
Each of our clients had a consumption history one year prior to following our Water
Management Program. We used those records as a base to compare our Water Management
Program to. EBMUD provided our clients with the records and our clients then forwarded
them to us. These graphs are based on accurate information. The graphed lines were
determined by the water consumption records that were forwarded to us by our clients.
Graphs
* Graphs may appear uneven on some browsers *

|
Customer #31
Blackhawk
Lawn is approximately 3950 sq. feet
Landscape is approx. over 10,000 sq. feet
pool
Graph represents 1990
approx. total gallons used in 1990 was
559,317
|
 Customer #31 Customer #31
Blackhawk
Graph represents 1991
approx. total gallons used in 1991 was
334,895
Approx. total gallons saved in 1991 compared to 1990 was 40%
|
 Customer #31. Customer #31.
Blackhawk
Graph represents 1992
approx. total gallons used in 1992 was
403,722
Approx. total gallons saved in 1992 compared to 1990 was 28%
|
|

|
 Customer # 18 Customer # 18
Blackhawk
Lawn is approx. 800 sq. feet
Landscape is approx. under 10,000 sq. feet
Graph represents 1990
Approx. total gallons used in 1990 was
252,704
|
 Customer # 18 Customer # 18
Blackhawk
Graph represents 1991
Approx. total gallons used in 1991 was
188,335
Approx. total gallons saved in 1991 compared to 1990 was 25%
|
 Customer # 18 Customer # 18
Blackhawk
Graph represents 1992
Approx. total gallons used in 1992 was
168,640
Approx. total gallons saved in 1992 compared to 1990 was 33%
|
|

|
 Customer # 45. Customer # 45.
Moraga
Lawn is approx. 4024 sq. feet
Landscape is approx. under 10,000 sq. feet
Graph represents 1990
Approx. total gallons used in 1990 was
221,278
|
 Customer # 45 Customer # 45
Moraga
Graph represents 1991
Approx. total gallons used in 1991 was
173,384
Approx. total gallons saved in 1991 compared to 1990 was 22%
|
 Customer # 45 Customer # 45
Moraga
Graph represents 1992
Approx. total gallons used in 1992 was
224,273
Approx. total gallons inceraseed in 1992 compared to 1990 was 01%. New back lawn was installed.
|
|
... End of chapter 7


Customer #31
Customer #31.

Customer # 18
Customer # 18
Customer # 18

Customer # 45.
Customer # 45
Customer # 45
